At the 4C Health, Safety & Environmental Conference, Emerson’s Mark Nixon presented Early Prediction of Flare – Big Data. Here is the presentation abstract:
A Data Analytics System able to predict 79% of the flare events. We present the successful application of a hierarchically distributed monitoring approach for flare event prediction in a refinery with a flare gas recovery system installed. We use various data analysis tools, including principal component analysis, slow feature analysis, and wavelet transform, under a distributed process monitoring framework to achieve monitoring solutions. The application of a hierarchically distributed monitoring framework using both time and frequency domain techniques is able to detect 11 out of 14 events before they actually occurred.
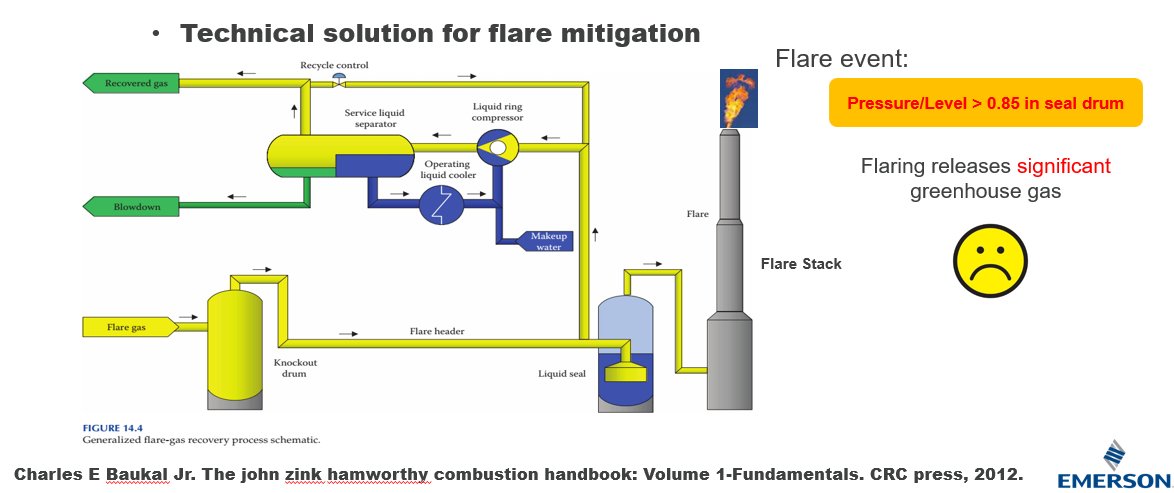
Mark opened his presentation by describing a flare gas recovery system (FGRS). He shared a story of a customer that had an objective of zero flare events per year with the ability to predict conditions that lead to flare events with enough lead time (≥15 minutes) to act. It was also very important to provide operators with indicators showing units causing flares.
Challenges this producer faces included:
-
- Numerous (18 units) feed flare system
- Time-variant, non-stationary and multimodal operation process
- High-dimensional data
- Noisy and oscillatory behaviors
- Small number of flare occurrences
He described some of the techniques used in the prediction of flare events:
- PCA – principal component analysis
- DPCA – dynamic PCA (account for time lags)
- WT – wavelet transform
- SFA – slow feature analysis (include derivatives of PV)
- H – hierarchically apply to individual units and then overall
They tried numerous approaches and the hierarchical with PCA and SFA was able to predict 11 out of 14 flare events which were better than every other approach. Once this approach was established as the best approach, the project team interviewed plant subject matter experts (SMEs) to derive requirements for long lead event detection during process monitoring. They identified specific abnormal process control event, specific decision task, associated information set, and detection algorithm properties for the project.
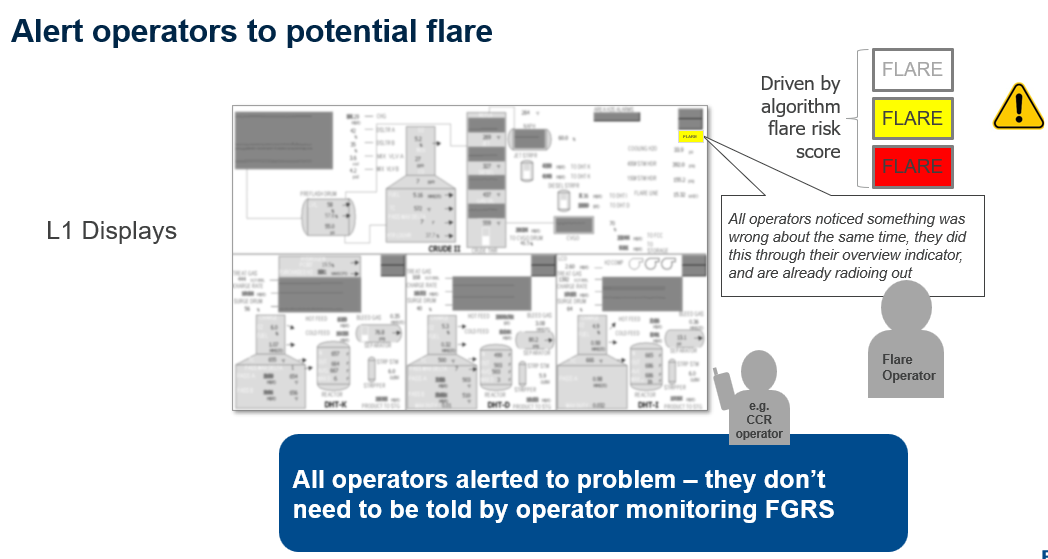
From there, they conducted task analysis with operators to identify tasks, decisions, and information requirements. Next, the project team prototyped existing HMI formats for depicting leading indicators for event detection/prediction. They applied relevant scientific and design guidelines and concepts to support users’ task and cognitive needs to design new level 1 and 2 concepts and produced design illustrations. After this design phase was completed, they performed cognitive walkthroughs with the SME in the assessment phase.
Once implemented, all operators were notified when a flare event was predicted. They also had bonuses tied to avoiding flare conditions so they were highly motivated to pay attention to these alerts.
Mark concluded by noting that a general distributed monitoring framework has been created to predict the flare event occurrence ahead of time. Both time-domain and frequency-domain approaches have been implemented at unit-wise and hierarchical monitoring levels. This model predicted 11 flare events and an HMI design helped operators get early warning on the conditions leading to a flare event.