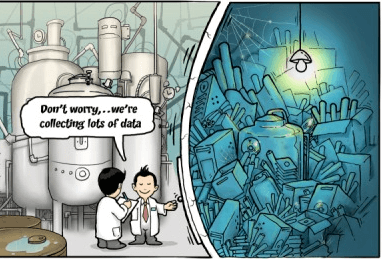
As organizations have started to come to terms with the big data sets they have been collecting, they have started to look for strategies and tools to help them make decisions about what products to make and how to make them most efficiently.
 For highly regulated industries such as pharmaceutical and biotech manufacturing, making sense of the vast wealth of collected data around batches can be a difficult if not intimidating task.
I caught wind of an upcoming webinar by Emerson’s Dr. Robert Dvorak and Bioproduction Group‘s Dr. Rick Johnston. Bob leads the data and operations management team and Rick is the CEO of Bioproduction Group. The webinar is on visualizing and analyzing electronic batch data in real time.
In the seminar, they plan to describe the mining of electronic data from Emerson’s Syncade Suite Operations Management software, visualizing and analyzing it in real-time as well as how Bio-G’s Crosswalk software allows this validated data source to display real-time batch data and associated parameters.
The goal of visualizing operations data is to better understand what is occurring in the process in real time, providing a basis to model the process to allow for better coordination and productivity of the manufacturing and planning teams, and ultimately an optimized biomanufacturing process.
They also plan to describe an approach to data consolidation across multiple data sources. This approach avoids data duplication and warehousing of data, while increasing the visibility of and access to automation system data. Specifically, they’ll address:
- Syncade as a tool for collecting critical process data
- How Syncade helps to contextualize data through recipes
- How Bio-G’s software automatically links to Syncade data
- How this integration with Bio-G allows visualization of batch timing data on Gantt charts
- Building dashboards of critical process parameters and critical quality attributes
- Exporting data to Excel and other formats
- Analysis of this consolidated, real-time data leading to better decision making
Bob and Rick are hosting the webinar twice, once for the European, Middle East, and Africa time zone, and a second for the Americas.
If you’re in a highly regulated industry and wrestling with large data sets in your decision-making process, one of these sessions might be an hour well spent.


