Pulp and paper manufacturers have lived in a period of time of extended price softness for their products. This as well as other market and economic forces have kept their focus on reducing cost per ton of production to help their margins. Pulpandpaper.net recently reported some optimism although not in the near term:
So far, prices for paper and pulp have not risen, in fact they remain weak in North America. But some firms around the world are beginning to get slightly larger orders from European buyers, market analysts said.
I spoke with Bryan Moss, a fiberline consultant in our Pulp and Paper industry organization. He advises pulp manufacturers to look at improvement projects as far upstream in the process as possible. The impact of these optimization efforts can ripple through the process in the form of better quality, lower energy usage, and reduced raw material consumption.
One area pulp mills have had success in reducing their cost per ton produced is in the kraft pulping process, specifically with their kraft batch digesters. The Pulp and Paper industry team has packaged their expertise to optimize the performance of the individual digesters and the controls common to all of them.
The process typically begins by working with the mill to understand the key performance indicators, areas where the mill is limited, and current operational performance versus target performance. An example of this data analysis includes a KPI on quality such as a Kappa/K#/P# scatter graph and it’s correlation to H-Factor and grades.
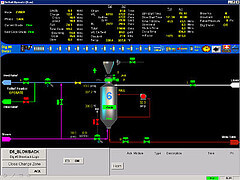
 Around the individual batch digesters are controls developed for the phases: chip and liquor filling, bring-up, cook, blow, relief and blowback, and the cooking model. Controls common to all the batch digesters are optimized including: chip system, liquor, scheduling, pulp quality, and steam limiting and smoothing. Smart alarming is added so that the alarm levels are appropriate for the operating phase of the digesters. Automatic production reporting provides the mill management with an information windshield to drive the process in the required direction, with reports available by blow, shift, day, month and annual summaries.
Results from the optimization process typically include a reduction in white and black liquor usage of 1-2%, reduced steam usage 5-15%, reduced batch cycle time 5-15%, and an increase in overall yield of 0.5-3%. Bryan adds that naturally these results vary depending on process constraints.
Bryan stresses that the key is to have an optimized solution which the operators trust to not override in manual mode. To accomplish this, the team provides history and analysis tools, training and education, and ongoing support. The design philosophy is for the operator to be no more than 2 clicks away from any information.


