
Jeff Dymond
iOps Consultant

Brian Atkinson
Lifecycle Care Program Manager
 In a Plant Engineering article, Take command of your operations center, Emerson’s Jeff Dymond and Brian Atkinson describe how Integrated Operations (iOps) Command Centers can provide multiple types of graphics for cross functional teams to use for optimal operations.
They open:
In the past, plant personnel had to live close to their job. Every aspect of plant operations was located at the plant site except for perhaps sales, marketing, and executive management. People today want to work where they live, but not necessarily live where the work really is. Where the “job” is could be dangerous, dirty, and distant, and frankly the location could be just plain dull.
Industries such as oil & gas, refining, power, and mining are more likely than other industries to take an iOps approach given the challenges and locations where they operate.
To attract the specialized expertise required:
An iOps command center is typically located in a central or convenient location that’s appealing to the people you need to have on hand to make optimal decisions quickly: engineers, control specialists, traders, maintenance planners, operators, safety personnel, security personnel, and others.
Jeff and Brian describe the types of graphics required for iOps—analytical graphics, situational awareness overview graphics, and operational process control graphics.
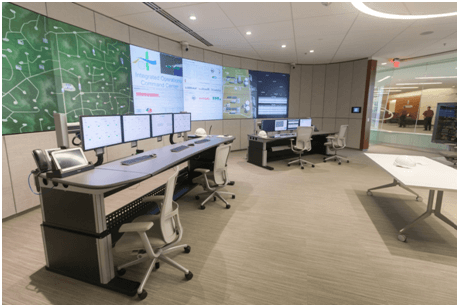
iOps Command Center
Analytical graphics:
…is from department functional metrics to business key performance indicators (KPIs) in formats such as tables, trends, and bar and pie charts. KPI formats are used to quickly visualize large amounts of information. Analytical graphics have multiple information sources such as the ERP system, automation system, enterprise historian, accounting and production scheduling systems, and Internet information sites such as those showing real-time pricing data.
Situational awareness overview graphics:
…display information within a plant operator’s domain of responsibility. This may be all the process units in a plant, or all the units associated with a process stream, such as a distillation column, a network of wells, or a pipeline. The main function of this overview graphic is to provide high-level situational awareness that enables an operator to determine if his or her overall domain of responsibility is operating as designed within four seconds.
Operational process control graphics:
…on an operator’s console display have more detail than the situational awareness overview graphic and are typically presented only on process system console monitors. Operators and maintenance personnel use these graphics to monitor alarms, make process adjustments, and view the health of field instruments and equipment. These graphics are where the operator gathers detailed information to make a decision, and then takes action to change the process.
The specific needs of a company dictate the graphics hierarchy and display technology required for an iOps command center. Key in the design is to understand the roles of the command center members and applying a human centered design approach to provide the information required to provide members access to the information they require to effectively do their jobs.
They highlight the 5 main characteristics for these graphics—roles, scope, information sourcing, navigation, and information technology (IT) requirements. Check out the article to see how these characteristics are applied to the three types of graphics.
I asked Jeff how he would summarize what’s required for an iOps command center. He shared:
Companies need the ability to track, display and act upon a vast amount of information that’s vital to business operations. Integrated Operations Command Centers benefits the business with faster response to problems and opportunities. Determining the graphic hierarchy and the type of graphics needed to provide access to information quickly enables the business to act profitably to these business opportunities.