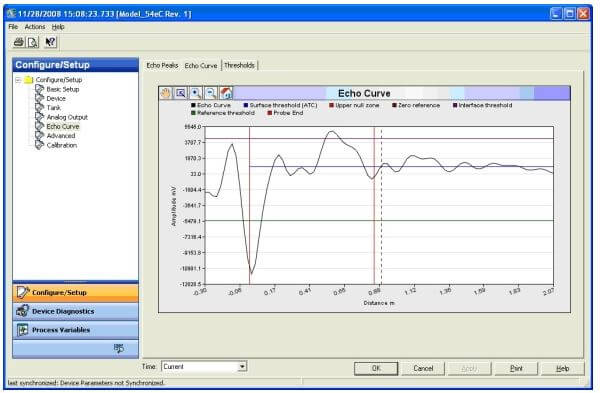
In last week’s post, Refinery Desalter Guided Wave Radar Level Measurement, Emerson’s Jonas Berge added a comment with a link to an article he wrote about the setup, calibration, and diagnostics of guided wave radar (GWR) level transmitters. The article, New EDDL is guiding radar: interface level made easy appears in the Australian Process Online website.
He describes the use of guided wave radar technology:
A single GWR level transmitter measures both the tank’s upper surface and the lower product interface between two stratified liquids. Thus, additional tank penetrations are not necessary. GWR level transmitters are capable of measuring the interface in crude oil, as well as other liquids. Examples of interface level applications include separators and settling tanks.
By incorporating electronic device description language (EDDL), GWR transmitters connect with device management software to display many types of diagnostic plots including:
- Echo curves
- Surface threshold
- Interface threshold
- Reference threshold
- Hold-off distance (null zone)
- Zero reference
- Probe end
Through the common communications format established by the EDDL standard, complex graphs such as GWR echo curves can be viewed for advanced setup and troubleshooting. Jonas notes:
Using an echo curve graph allows viewing of the measurement signal amplitude from the top to the bottom of the tank and gives an instant view of the echo waveform. Solving measurement problems can be done by studying the position and amplitude of the different pulses along the probe.The echo peaks in the tank help identify the reference, surface interface and unknown false echoes from disturbing objects.
Jonas describes how the EDDL standard supports the use of wizards to provide step-by-step setup guidance. He shares an example of the Measure and Learn wizard, that:
…activate the function inside the transmitter which automatically detects the echo curve and fits the ATC [amplitude threshold curve], taking the technician step by step through the set-up process.
Jonas shares other examples such as the addition of tank geometries to convert the reading to a tank volume measurement and product experience and application know how in accessible pictures, diagnostics interpretations, product manuals, plant documents, and other documentation.
Give the article a read to see the illustrations and examples of how EDDL makes the setup, calibration, and diagnostics accessible to the plant operations and maintenance teams.

