Last week, Emerson’s Tom Wallace posed the question Are Human-Technology Interactions Solving or Causing Problems? in part one of a two-part series. Today, Tom explores this question by looking at how we learn, how we think, and how this applies to human-technology interactions.
How we learn. Tom notes that there are a variety of learning modes. The two most common are visual learning (see and learn) and kinetic learning (do and learn).
Visual learning. Our visual cortex is hardwired to recognize and learn patterns. Next, we’re good at assessing if a pattern is normal or abnormal, and an opportunity or a threat. We do this with very complex stimuli in a fraction of a second. Human centered design presents information in familiar visual patterns that can quickly be interpreted as significant and normal or the abnormal.
Kinetic learning. We learn by doing. The two biggest factors are repetition and extrapolation. Chocolate tastes good; chocolate with nuts also tastes good. That’s repetition. Chocolate with fruit would probably taste good too. That’s extrapolation.
In human centered design (HCD), it’s accomplished by being consistent in navigation and operation. When faced with a new interaction, people see if it looks like something they already know. If it does, learning and productivity both improve. If it doesn’t learning is slowed. If it breaks a previous pattern, previous learning can actually be lost. This is based on the human reward system. Our brains make success feel good and failure feel bad. Proper human centered design taps into human motivation, to improve efficiency and satisfaction.
Tom shares that the consistency of an HCD approach promotes synergistic effects. The more things that are done right and consistently, the higher the probability of success. Work is done faster, errors are reduced, less experienced people successfully complete more complex tasks, and worker satisfaction and motivation improve.
Conversely, the more things are done wrong or inconsistently, the lower the probability of success. Work takes longer, and performance improves slowly, or even deteriorates. Finally, less experienced people have a significantly lower chance of correctly completing the work.
How we think. A single glance can provide a lot of information back to our brains. Tom explains that the typical human brain can maintain 3-5 things in short term memory. If all the information needed to reach a conclusion is co-located in one place and is presented in consistent ways, it reduces the burden on short-term memory and promotes success.

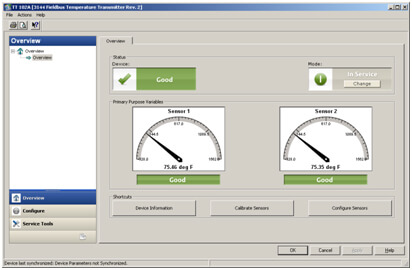
Visual indicators such as the color green, a “checkmark”, meters showing values within normal range, and the word “good” all show this device is operating normally. Over 60% of human – device interactions are to check device status. Good human-centered design shows status at a glance.
Research supports the value of design simplicity:
Did you know? A cluttered user interface with unneeded images, colors, and data fields increase the chance of human error up to 10X.
Work by research organizations such as the Center for Operator Performance has uncovered the importance of operator graphic design. We touched on some of these dimensions in an earlier post, Operator Display Color Usage Study.
Shape, alignment, orientation, repetition, and color all draw the human eye differently. If used correctly, these can bring clarity, speed visual processing and draw attention to relevant information.

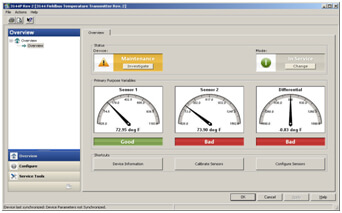
Visual indicators such as the colors orange and red, and the words “Maintenance” and “Bad” indicate and locate abnormal conditions. Recognition is immediate and access is intuitive.

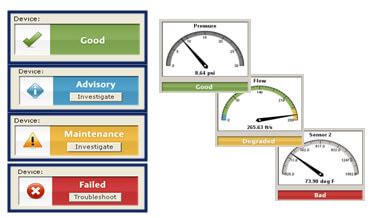
Color indicates normal and abnormal status conditions, and guides associated actions. Green is associated with “good” and “no action required.” Blue and orange are associated with the possible need for action. Red is associated with failure and the need for troubleshooting and repairs.
Tom stresses that the human–technology interface should have what’s needed to complete a task located in one place. If navigation to different places is needed, short-term memory is stressed leading to errors. Errors include incorrectly executed or missed steps, or steps executed out of order. Troubleshooting is also more difficult, increasing the time and reducing the probability of successful problem resolution.
He highlights another statistic on the importance of human–technology interface design:
Did you know? A poorly designed user interface requiring navigation to multiple screens to complete tasks can increase the chances of human error up to 13X.

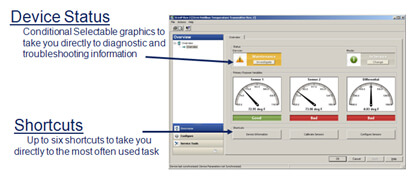
Graphical indicators used to show status are also clickable fields that launch appropriate troubleshooting displays. Shortcuts to the most frequently performed tasks are provided in a consistent location. These two provide navigation to over 95% of user activities with a single key click.
The basis for effective design begins with a solid understanding of how we learn and how we think. From there, it’s important to take a human-centered design approach to put this understanding into practice.
