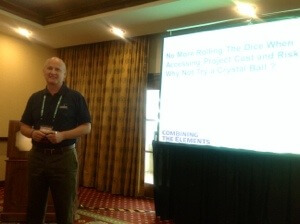
 Emerson’s Gordon Lawther shared ideas in project cost estimation and risk assessment. His abstract:
Every company has a method to estimate cost and access risk when compiling a business case. In many instances the data resides in a spreadsheet containing line item values of cost estimates, assumptions, risk factors and contingencies. Invariably the data entries are static and the results presented do not adequately show the likelihood of success. This workshop will focus on cost and risk assessment using a dynamic spreadsheet model to simulate the probability of success given a range of scenarios and help decision makers understand the variables having the greatest impact on the case.
He opened describing a fictional chemical company with high process variability, lower overall equipment effectiveness (OEE) than industry norm, higher production costs than norm, and lower energy efficiency. He shared a baseline operating model that had an overall profitability of 17.24%. The model included unplanned downtime, actual production, off-spec production, costs and sale prices, and asset cost.
This company had goals to reduce unplanned downtime, increase OEE, and reduce offspec product by reducing process variability.
The scenario was what if the next planned shutdown was increased from 5 to 10 days to increase the amount of system modernization that could be performed. Gordon showed a business as usual case with inflation for prices and costs, resulting in unchanging profitability.
The modernization project scope would include replacing DCS and PLCs, E&I design and installation, critical valves, asset management software and services, installation and startup.
The projections were run showing the financial impact of a reduction in downtime, increase in OEE, and reduction in variability. The benefits would come from the new valves and precise tuning for tighter control loops, ensure all loops are in automatic, and more. For a maintenance perspective, practices would move from reactive to proactive.
By providing levels of uncertainly around the estimates, a Monte Carlo simulation can be run to assess the impact of changes in the estimates. A sensitivity analysis can provide information about which assumptions have the greatest impact. Distribution models are chosen for the parameters in the simulation. Gordon put a normal distribution/bell curve into his simulations. He also ran uniform distrbutions where any value within a range is equally likely.
By finding which estimates have the greatest impact on the estimated results, more focus can be placed to tighten the estimate. In other words more front end engineering work can be applied to both the cost estimates and pilot projects to quantify the benefits.
His demo included the use of a Monte Carlo simulation addin for Excel to run the numbers. The end result is that estimates can be provided with confidence intervals.
