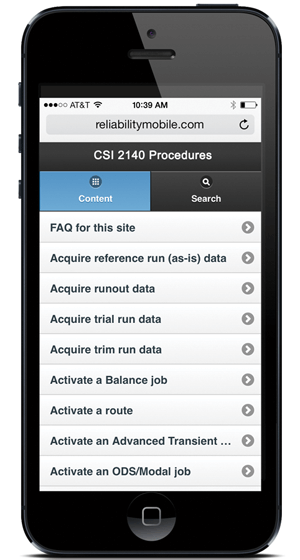
 The growing impact of smart phones and tablet technology continue to impact our everyday lives, including our world of process automation. I heard from some friends on Emerson’s Machinery Health Management team of a new mobile site, the CSI 2140 Mobile Procedure. It provides maintenance personnel access to instructions for common vibration analysis tasks from a mobile device.
In an earlier post, Portable Vibration Analyzer-Human Centered Design Style, I shared some improvements in this device to increase the efficiency of route-based machinery vibration collection and analysis.
For this mobile site, instead of providing the entire product manual in a mobile web-based format, a human-centered design, task-based user interface is provided.
The site lists common tasks that are typically performed. Many tasks include the prerequisite steps required to perform the task, a step-by-step procedure to follow, and the results of the task that one should expect. Other tasks provide an overview of the task followed by a step-by-step procedure.
For example, the task to collect a vibration waveform provides this overview:
A vibration waveform is a graph that shows how the vibration level changes with time. The waveform shows the vibration level at a particular time during the measurement.
The waveforms are discrete graphs represented by a series of equally-spaced, discrete sample points (connected by straight lines). The more sample points in a spectrum, the higher the resolution of the waveform and the more memory used.
Here is the step-by-step procedure:
- Create a job or open Analyze from a route measurement point.
- From the Analyze main menu, press F1 Manual Analyze > F1 Set Analyze Mode.
Use the up and down arrow keys to select Waveform.- Press Enter. The Analyze Setup screen appears.
- Set the following options as necessary.
[table]
Option[attr style=”width:120px”],Description
F2 Set Fmax,Set the maximum frequency for the waveform.
F2 Set Sample Rate,Enter a value between 25.6 and 204\,800 for the number of samples per second. The default is 1\,024.
F4 Set Samples,Enter a value between 256 and 32\,768 for the number of samples to collect. The resolution of the waveform increases with the number of samples used. The more samples\, the more information the waveform contains. The default is 1\,024.
F5 Set Sample Time,Enter the total time that data is collected for each waveform. The duration of a waveform is the total time information is collected from the waveform. The default is 1. Note: Enter either the sample time or the number of samples. Setting one adjusts the other automatically.
F7 Tach Setup,Set up the tachometer parameters. See Set up a tachometer.
F8 PeakVue Demod,Enable or disable PeakVue or Demodulation. See PeakVue and demodulation.
F9 Set Trigger,Select the type of trigger to use to start the measurement. See Triggers.
F12 Input Setup,Set up the input channels\, the sensor type\, and the units for the acquisition type.
[/table]- Press Enter to collect the data. One or more plots display the data.
- Press F9 Store Data to save the data to a route or a job, or press F8 Start to redo the measurement.
The Machinery Health team invites your feedback on this application to continue to refine and make it more valuable for maintenance professionals.
Give it a try and see what you think.
You can also connect and interact with other machinery health professionals in the Asset Optimization, Maintenance and Reliability track of the Emerson Exchange 365 community.
