Emerson’s Peter Wang is a very active voice in the geophysical part of this industry. He recapped his 2017 public activities in a great LinkedIn post, 2017 Personal Year in Review – Talking about Geophysics. Let me recap a few items from some of his blog posts and invite you to subscribe to the blog.
In a post, The Robots Have Come to Seismic Interpretation, Peter describes the machine learning in applications such as Google Photos that can recognize the content within a picture and return the pictures in search results. This same machine learning technology has come to seismic interpretation software such as Paradigm Rock Type Classification. He notes how our brains have dimensional (3D) limitations. Machine learning:
…has no such limitations. Why not unleash neural networks on a prestack gather, and let them try to learn from all of the richness in that dataset, as well as from well control, in order to try to classify a volume of data which would otherwise be untouchable without simplification?
Why don’t we let machine learning classify our prestack seismic, just like they classify my Google Photos?
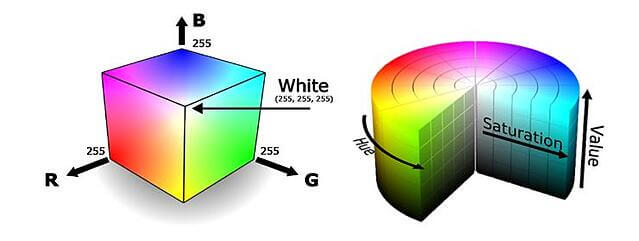
In another post, The (Color) Bar Has Been Raised – Interpreters Need an Upgraded Toolkit Now, Peter explains what is meant by RGB and HSV blending, and why they are important:
RGB refers to the red-green-blue color map, and HSV to the hue-saturation-value color map.
We can use these color maps to blend up to three seismic attributes at a time. It is important to remember that blending technology can be applied to 2D or 3D seismic volumes, or 2D grids (maps). It is also possible to use subtraction or multiplication of any two attributes as another blending technique.
He notes that many different displays are possible, limited only by the interpreter’s imagination. Examples include:
- Low, middle and high frequency band outputs from Spectral Decomposition, used to visualize stratigraphic features (RGB or HSV).
- Three seismic cubes, with -1, 0, and +1 vertical sample shifts, used to visualize stratigraphic features. The shifts do not have to be ±1, other values may be used (RGB or HSV).
- AVO intercept and gradient (subtract or multiply).
- P-Impedance, Vp/Vs Ratio or Poisson’s Ratio (subtract or multiply).
- There are several different curvature attributes, the three most common being Most Negative, Most Positive Curvature and Curvedness. These are helpful when predicting fractures, making them useful for shale exploration
- Coherence Cube is always a good attribute for edge detection, and it works well as the “V” channel of HSV, with “H” and “S” choices left to the interpreter.
Read the post to see many examples of these visualizations. Visit Emerson’s Paradigm site to learn more about the technologies and solutions to help oil & gas producers achieve greater performance in capital investments and operational efficiency within new and established reservoirs.
You can also connect and interact with other oil and gas exploration and production industry experts in the Oil & Gas group in the Emerson Exchange 365 community.


